/alerts
All currently active US, Canadian, and European alerts as issued by the National Weather Service (NWS), Environment Canada (EC), MeteoAlarm, Australian Bureau of Meteorology (AUSBOM), and the UK Met Office.
Customize and integrate high-resolution WebGL-based weather visuals and animations.
)
MapsGL is a high-performance weather mapping SDK for building fully interactive, data-rich weather visualizations directly into your applications.
weather layers
globe view
rendering types for full visualization control
historical, real-time, and forecast data
MapsGL renders weather data client-side using modern graphics technology, enabling smooth animations, fast load times, and precise control over how data is displayed. Prebuilt weather layers such as radar, satellite, and forecasts integrate quickly, with full flexibility to customize styling, behavior, and user experience.
MapsGL turns complex weather data into intuitive, responsive visual experiences. It is designed for teams that need production-ready weather maps without sacrificing performance, control, or developer efficiency.
Getting started with MapsGL requires an active Xweather Weather API and Maps subscription and integration with one of the following third-party mapping libraries: Mapbox GL, MapLibre, Google Maps, or Leaflet.
Client-side rendering
MapsGL renders weather data entirely in the browser, giving complete control over how it is visualized and presented.
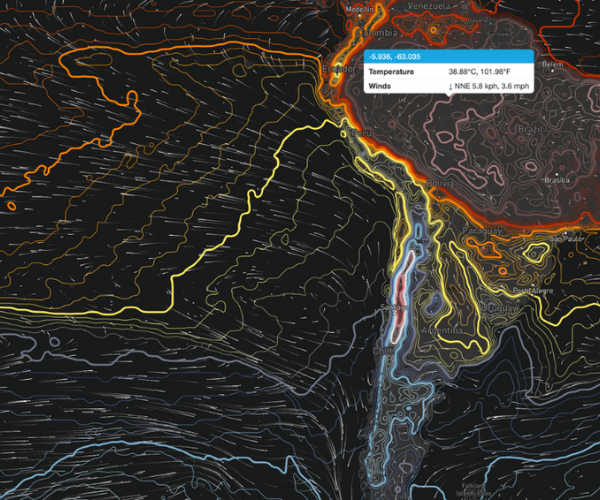
Real-time data queries
Quick and easy access to all the data driving map visualizations. Map coordinates retrieve all data at a given location from all active data sources and layers.
Efficient data loading
No need to load static map tiles for every zoom level. Data is only loaded up to the maximum resolution of the data source.
Fully customizable weather visuals
WebGL technology renders from the data rather than imagery files, so display properties can be adjusted on the fly to match any application's requirements.
Xweather Live is an online application built with the Weather API and MapsGL products.
Switch layers, customize colors and animations, explore a variety of weather focus views, and test the Phrases API chat.
View as a flat map or a 360° globe.
Go to Xweather Live
All currently active US, Canadian, and European alerts as issued by the National Weather Service (NWS), Environment Canada (EC), MeteoAlarm, Australian Bureau of Meteorology (AUSBOM), and the UK Met Office.
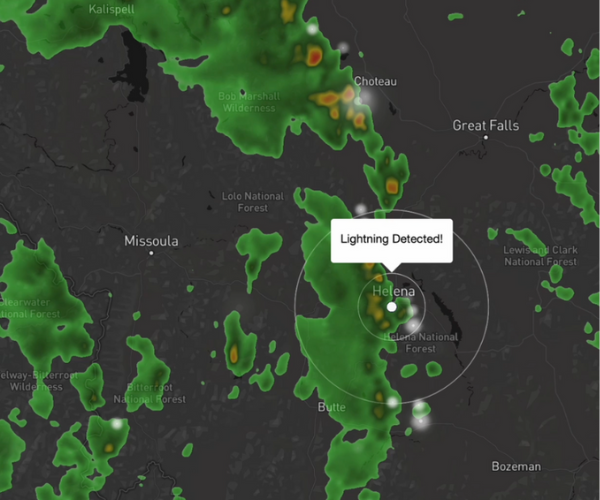
Aggregated cloud-to-ground and intracloud lightning flashes. This layer is a composite layer that is a combination of the following layers: lightning-flash, lightning-strikes
Provides information on potential severe weather, including thunderstorms, tornadoes, damaging high winds, and hail as issued by the Storm Prediction Center (SPC).
Depicts the condition of the road surface, such as dry, moist, wet slush, snow, or ice in the contiguous US. Road weather data is currently available for the US, Europe, Japan, Australia, and New Zealand.
Hail nowcast providing current and forecast hail threat areas. This layer is a composite layer that is a combination of the following layers: hail-threats-polygons, hail-threats-tracks, hail-threats-points
The MapsGL SDK includes a variety of preconfigured weather layers you can quickly add to your maps. The built-in weather layers are already configured with default styles, but you can fully customize their appearance.
)
)
Surface wind speeds and direction depicted by particles moving in a vector flow field
)
)
Snow depth on the ground
)
:focal(1040x1789:1041x1790))
Track tropical cyclones
Customize color ramps, opacity, particle density, and animation speed across any weather layer.
Adjust styling on the fly
No data reloading
Preview changes in real time
A fully functional, feature-rich interactive map application that can serve as a weather dashboard or be integrated into custom weather applications.
Build weather apps and maps with a free developer trial.
The MapsGL SDKs make it easy to visualize real-time weather and geospatial data, animate it over time, and style it to match your brand or UX. Core concepts include map controllers, data sources, layers, and animation timelines, providing a structured way to manage multiple data feeds and overlays in a single map.